A transit planning simulation

Four thousand people work in that tract.
Nobody has ever run a line to it.

Take office in one of 54 real US metros, pick a decade between 1920 and 2040, and build a network against real census tracts, real jobs by workplace and real observed commute flows — on a four-step demand model that shows you its working.

Minneapolis–Saint Paul, 2025, complete. Runs in the browser. No account. MIT licensed.

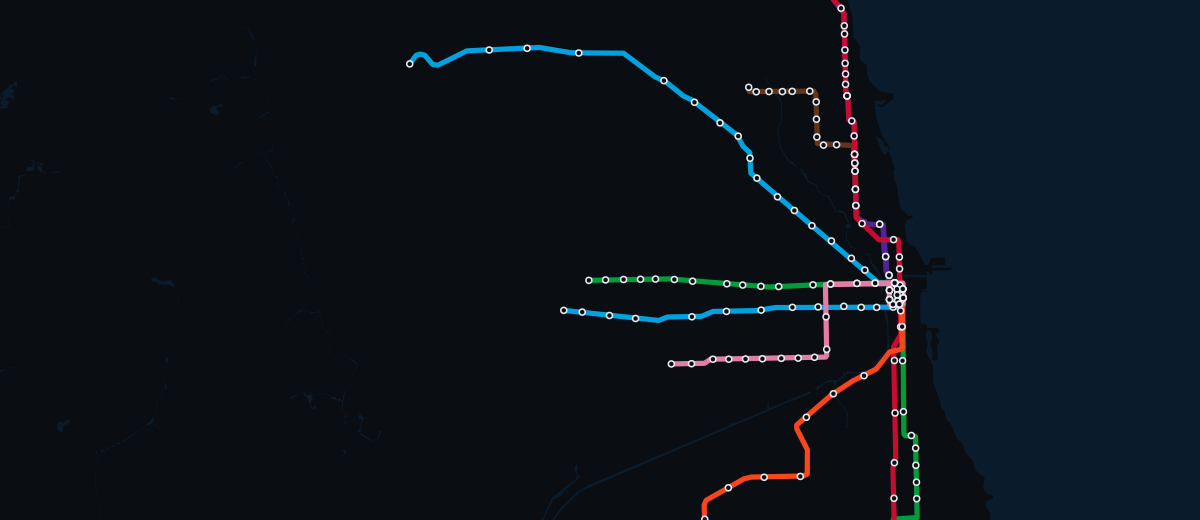
    Eight lines, 185 stations. Count the pips on any line: that is the end-to-end run time divided by the headway, both directions. Ground: Census 2020 tract population · TIGER hydrography · FHWA HPMS class 1. Network: CTA published GTFS — observed, not drawn by us.
    • Plays offlineEvery city pack is a file in the repository. Load it once, then pull the plug.
    • No account, everNothing to sign into, nothing phoned home, no server that can fail to answer.
    • The free edition is the whole modelOne complete metro and one decade, with every system in it. Not a crippled demo.
    • 54 US metros, and that is the scopeUnited States only at launch. You should hear that here rather than find it out.
    • Open source, AI disclosedMIT licence. Built with AI assistance, stated up front and in the README.
    AWhat it is

    You are the planner. Not the driver, and not the mayor.

    You inherit a real American metro, drawn from its real census tracts, with the transit it really has and the traffic it really carries. You decide where to spend money you will have to answer for. Then a travel-demand model of the kind a metropolitan planning organisation actually runs tells you how many people used it — and, when you ask, exactly why.

    Read a real city before you draw on it

    Hover any tract for its real population, density, households, under-18 share, jobs by sector, resident workers and median household income — with its GEOID, so you can check it against the Census one tract at a time. Where the Census suppresses an income, the pack records it as unknown and never invents a figure.

    Census 2020 PL94-171 (P1/P3/H1) · ACS 2018–2022 B19013 · LEHD LODES8 2022

    Commit money you answer for

    Every alignment has a price: at grade, on a reservation, elevated, or in tunnel — and tunnel runs four to five times surface, with an underground station several times more again. Cost and schedule risk are drawn once, when you commit, from the run's own seeded stream. You cannot reload to escape a bad draw.

    construction.ts — log-normal overrun, calibrated on Flyvbjerg’s 258-project sample

    Run a service not just a map

    Track is not service. Headways across six periods including evening, night and weekend; consist lengths; skip-stop and express patterns; fleet ageing and procurement lead times. Three operating dials the board votes on, and a workforce that notices what you do with them.

    policy.ts — service level, wage ratio, maintenance funding

    Find out if you were right and why

    Four-step demand: trip generation, gravity distribution seeded on observed commute flows, nested-logit mode choice, frequency-based assignment, solved to equilibrium over crowding and road congestion. When ridership moves, the attribution panel says what moved it and shows the residual it could not explain rather than folding it into whichever term was largest.

    explain.ts — attribution, not decomposition

    What it is not: a route-painter where ridership is a function of how pretty the line looks, and not a city-builder where you zone the demand into existence. The demand is already there, measured, and largely indifferent to you.

    BSteps to victory

    Six ways to win, and every one of them is set by your city.

    There is no score to beat and no target somebody picked. Each condition is computed from the metro you inherited on the day you took office, so winning in Houston is a different job from winning in Boston — and the run continues after you win, because a network you stop improving is not a network that stops needing it.

    1. Transit Capital

      Double the regional transit mode share you inherited and hold it for a year, with a 6% floor so a small number cannot double into another small number.

      6% region-wide is top ten in the US

    2. Roads Unclogged

      Cut peak road congestion by half against the counterfactual — what the region would have had without your network — not against the day you started.

      the volume-delay curve is quartic

    3. Carbon Negative

      Net tonnes avoided, scaled to your metro's population, after charging the network for what it burns. A diesel bus at 20% occupancy is worse per passenger-km than a car with one person in it.

      coverage bought with empty buses moves this the wrong way

    4. Held the Line

      Finish a year in surplus with rider satisfaction above 65% and punctuality above 80%. All three at once — the cheapest route to a surplus is cutting the service that produces the other two.

      the condition that cannot be bought

    5. Within Reach

      Put half the metro, or 60% more than you inherited, within walking distance of a stop. Coverage and farebox recovery pull against each other — always.

      you have to choose which one you are for

    6. Ten Minutes Back

      Cut the average regional commute by a tenth. The only target measured on what every resident experiences rather than on what your riders do — including the people who never board a train.

      a network that takes cars off the road shortens the drive for everyone left on it

    None of these is a checkbox. They pull against each other on purpose: coverage costs farebox recovery, frequency costs the surplus, and the carbon target punishes exactly the empty-bus coverage that the access target rewards. A run that wins all six is a run that found the trade-off rather than a run that ground out a number.
    cite: victory.ts — relative targets with absolute floors

    CThe decisions

    They arrive whether you were ready or not.

    Depth is not a list of features — it is whether the systems bite. Every decision below is one the model computes both sides of, and the constant underneath it is named so you can go and disagree with the constant. A choice with only an upside is not a choice, so none of these has one.

    C Platform 1 Next: go underground
    C Raise the fare The trap · 1 of 6
    Upside Revenue, every time

    |e| < 1, so the arithmetic never turns against you.

    What it costs Riders, approval, subsidy

    It empties the system, and the subsidy that follows riders leaves with them.

    Measured elasticity −0.52 — steeper than the −0.33 planners quote, because that rule was fitted to cities where riders had no car. economy.ts — measured by sweeping the fare, not assumed

    DThe city answers back

    Point at a district. It will tell you what it is, and what it read to decide.

    Nothing here was assigned by a designer. Every tract works out its own character once a year from its own live census and employment numbers — so a neighbourhood can stop being residential and become a secondary centre while you are playing, and the reason will be sitting in its own figures.

    ResidentialResidentialCampusCampusResidentialMixedMixedResidentialDowntownMixedMixedResidentialDowntownDowntownRetail corridorResidentialDowntownMixedMixedRetail corridorRetail corridorIndustrialOffice parkIndustrialIndustrialOffice parkOffice park

    Seven characters

    Hover or tap any parcel. These are the seven things a census tract can be in this model, and which one it is gets recomputed from its own numbers every year of the run.

    Ordered by evidence: a campus signal is unmistakable and rare, so it is tested before the generic jobs-versus-residents split that everything else falls out of.

    This is a diagram of the categories, not a picture of any real metro — a made-up map would invite you to look for a place you know. In a real run these are your actual tracts, and the office park that appears on your ring road in year six appeared because the jobs really moved there.

    Why this matters more than it sounds. The office park is named in the code as “the hardest thing in transit to serve well”, and if your growth keeps producing them on the edge of the region, that is the city telling you what your network did to it. Land use responds to accessibility, and accessibility is the thing you have been changing.
    cite: districts.ts — derived annually, never assigned

    EEvidence

    Which numbers come from the world, and which come from us.

    Getting this backwards is how a simulation starts lying to its players. So the game labels observed data observed, says when something is derived, and where it does not know, says so. Here is the whole table.

    Data provenance. “Observed” means it came from a published federal or agency dataset unchanged. “Derived” means we computed it from observed inputs. “Modelled” means we made it up according to a specified method, which is a different and weaker thing.
    QuantitySourceStatus
    Tract boundaries, centroids, land areaCensus TIGERweb, 2020 tract vintageObserved
    Resident populationCensus 2020 PL94-171, table P1Observed
    Population 18 and overCensus 2020 PL94-171, table P3Observed
    Occupied householdsCensus 2020 PL94-171, table H1Observed
    Median household incomeACS 2018–2022 5-year, table B19013Observed
    Jobs by workplace, by sectorLEHD LODES8 2022 WACObserved
    Workers by residenceLEHD LODES8 2022 RACObserved
    Home→work commute flowsLEHD LODES8 2022 OD, JT00 S000Observed
    Water bodies and roadsCensus TIGERweb Hydrography & TransportationObserved
    Traffic and lane countsFHWA HPMS 2020, functional class 1–4Observed
    Transit lines, stations, line coloursThe operating agency's published GTFS feedObserved
    Metro population by decadeDecennial census, 1920–2020Observed
    Income index, distance to centreComputed from the observed figures aboveDerived
    Non-work trip patternsGravity modelModelled
    Mode choiceNested logitModelled
    Road network topologyAbstract k-nearest graph over zone centroidsAbstraction
    Historical population distributionBack-cast by density-gradient pivot from the real 2020 distributionModelled

    What the model does not know. The largest abstraction is the road network: Interurban does not simulate streets. It connects zone centroids into a sparse graph with capacities scaled by the activity at each end and applies a volume-delay function to it. It will tell you correctly that a new line relieves a corridor. It will not tell you what happens at a particular intersection.

    Seven named limitations are written down in the model specification, not buried. Read them before you buy anything.


    Does it actually work?

    That is the whole question, so it is tested rather than asserted. On the real Minneapolis–Saint Paul pack, with lines drawn on the corridors the real system uses, nothing tuned to produce the answer:

    Validation. The modelled figures fall out of census population, LODES jobs, observed commute flows and the published coefficients. They were not fitted to the real numbers beside them.
    Network builtModelled weekday journeysThe real system
    One metro line, 16 stations27,500METRO Blue Line, ~25–30,000
    Three rail lines, 50 stations64,600Metro Transit rail, ~60–70,000
    Trip generation, all purposes3.94 / person / dayUS household travel surveys, 3.5–4.5

    The engine in src/engine/ is pure TypeScript with no DOM dependency and no Math.random anywhere: the same seed always produces the same game, which is what makes a claim like the one above checkable by somebody who is not us.

    This, and a great deal more, is already built.

    Fleet procurement and ageing. Station upgrades and second entrances. Express and skip-stop patterns. Fare structures with time-of-day pricing, concessions and monthly passes. A labour model with a strike. 112 events across six families. Land use that responds to what you built. Twelve ranks, six victory conditions, and an attribution panel that shows its residual.

    • Four-step model
    • Six time periods
    • Time-of-day fares
    • Concessions & passes
    • Strike risk
    • Fleet ageing
    • Station upgrades
    • Express patterns
    • 112 events
    • Land use
    • Career ladder
    • Undo/redo
    See everything →
    GThe metros

    54 of them, built by a script from federal open data.

    127,792,392 residents across 31,521 census tracts. No API key, no account, no scraping. Each pack is a file: every census tract in the metro with its real population and jobs, the observed commute matrix, the water, the roads, and whatever transit the agency currently publishes a GTFS feed for — drawn in that agency's own colours, with real opening years, so the 1960 map shows the 1960 network. Fifteen of the 54 start with real rail on the map; the other 39 start with nothing, which is also true of them.

    Every metro, with its real figures →

    HThe decades

    An era is not a vehicle catalogue. It moves nine levers at once.

    How many people there are, where they live, how many cars they own, what building costs in real terms, how hard land is to take, what the fare is, who pays the operating deficit, how willing Washington is to help, and what technology exists. In 1920 transit was a business that had to turn a profit. By 2025 seven of every ten operating dollars are somebody else's political decision.

    1920

    The Streetcar City

    Transit is how the city works, and it turns a profit. Almost nobody owns a car and there is no such thing as federal transit money. You are running a business, not an agency.

    Cars / household
    0.32
    Operating subsidy
    0%
    Federal match
    0%
    Real build cost
    0.42
    1950

    Postwar Boom

    The suburbs are filling and the cars are arriving. Ridership has peaked and begun its long slide. Construction has never been cheaper in real terms — and there is still no subsidy if you lose money.

    Cars / household
    1.00
    Operating subsidy
    0%
    Federal match
    0%
    Real build cost
    0.38
    1960

    The Freeway Era

    The streetcars have been torn out and the Interstates are being driven through the city. Transit is in freefall, Washington funds highways and nothing else, and the political climate is openly hostile. The hardest era to win.

    Cars / household
    1.22
    Operating subsidy
    5%
    Federal match
    0%
    Real build cost
    0.44
    1975

    Fiscal Crisis

    The city is broke, the fleet is falling apart, riders feel unsafe. But the oil shock has made driving expensive and Washington has finally started paying — eighty cents on the dollar for capital, if you can get the application in.

    Cars / household
    1.52
    Operating subsidy
    45%
    Federal match
    80%
    Real build cost
    0.62
    1992

    Rail Renaissance

    Flexible federal funding has arrived and every city wants a light rail line. Land is harder to take and environmental review is real, but for the first time in forty years the money is on your side.

    Cars / household
    1.78
    Operating subsidy
    60%
    Federal match
    75%
    Real build cost
    0.78
    2010

    Transit-Oriented

    Downtowns are repopulating and development follows the rail line. Federal capital money has grown stingier and slower, and three-quarters of your operating cost is somebody else's decision to keep funding.

    Cars / household
    1.86
    Operating subsidy
    68%
    Federal match
    50%
    Real build cost
    0.92
    2025

    Present Day

    The census data as it actually is. Remote work has hollowed out the peak, costs are the highest they have ever been in real terms, and you are subsidised for seventy cents of every operating dollar — for as long as the politics hold.

    Cars / household
    1.88
    Operating subsidy
    72%
    Federal match
    55%
    Real build cost
    1.06
    2040

    The Carbon Budget

    Driving is priced, density is mandated, and transit is policy rather than charity. Building has never cost more, but nobody is asking whether the network is worth it any more — only whether you can deliver it.

    Cars / household
    1.55
    Operating subsidy
    75%
    Federal match
    65%
    Real build cost
    1.25

    Population back-casting pivots the real 2020 distribution by the change in the density gradient rather than inventing a distribution from scratch, which keeps the real local structure — where the rivers and the rail yards and the university actually are — while moving the centre of gravity. eras.ts

    IWhat it costs

    Free to start. Twenty dollars to finish. No subscription, ever.

    The free game gives away the depth and limits the breadth, which is the opposite of how demos usually work. You get the whole simulation — the real model, the real data, the budget, the politics, the events, the strike — across thirteen real metros. What is bounded is how much city, how much history, how many kinds of vehicle, and how long. A demo that cripples the simulation would be advertising something the buyer does not receive.

    · Base
    Freeno account charge, no card
    • ✓
      The complete demand model — nothing simplified
    • ✓
      13 real metros, from New York to Houston
    • ✓
      Present day, 2025
    • ✓
      Metro, commuter rail, light rail and streetcar
    • ✓
      10 years in office
    • ×
      Needs an account and a connection

    Long enough to open a line, watch it fill, feel the operating cost arrive, face an election and take a fare decision. The whole loop, twice.

    · An expansion
    $5each · buy either, or both
    • ✓
      Surface — bus, bus rapid transit and ferry: the cheap answers, and when they beat rail
    • ✓
      Eras — seven more decades, 1920 to 2040
    • ✓
      Either one opens all 54 metros
    • ✓
      Either one removes the ten-year limit
    • ×
      Still needs an account and a connection

    The city list and the clock exist to make a free game a complete, finishable thing. Once you have paid anything at all, bounding you would just be rude — so either expansion lifts both.

    · The full game
    $20once · not a subscription
    • ✓
      Everything above
    • ✓
      All 54 metros, eight decades, every mode
    • ✓
      No time limit
    • ✓
      Every future expansion, at no further cost
    • ✓
      Plays offline. No account, no connection, no check-in

    Offline is the one thing money buys that nothing else does. Everything below this line resolves what you own against an account, and that needs a connection.

    Everything that differs, and everything that does not
     Base — freeFull — $20
    Metros you can play13All 54
    Decades2025 only1920 – 2040 (8)
    ModesRail onlyEvery mode
    Years in office10Unlimited
    The full demand modelYesYes
    Real census & commute dataYesYes
    Operating budget & three dialsYesYes
    Labour model and strikesYesYes
    112 events, land use, career ladderYesYes
    Bus, bus rapid transit, ferryNoYes
    Plays offlineNoYes
    Account and connection requiredYesNo
    Every future expansion includedNoYes
    PriceFree$20 once

    Nine of the fourteen rows are identical, and that is the point: what money buys here is more city, more history and more vehicle, never a better simulation. Either $5 expansion also delivers the first four rows in full.

    10%

    A tenth of everything this earns goes to pro-urban coalitions across the United States — the transit advocacy groups, the street-safety campaigns and the land-use reform organisations doing the unglamorous work of showing up to public meetings. It would be strange to make a living arguing that transit is worth building and give nothing to the people arguing for it where it actually gets decided. Where the money went is published.

    JThe ladder

    Twelve people who actually did this, in the order they get harder to be.

    Progression is a rank, and every rank is a real planner with a real biography, what they did, and the fact about them that is worth knowing. Beck was paid five guineas for the Tube map. Howard's famous diagram is captioned, in his own hand, “Diagram only. Plan cannot be drawn until site selected.” Jacobs beat Robert Moses in person.

    1. 01Harry BeckDraughtsmanLondon · 1902–1974
    2. 02Ebenezer HowardGarden City FounderLetchworth & Welwyn · 1850–1928
    3. 03Frank PickCommissioner of DesignLondon · 1878–1941
    4. 04Ildefons CerdàThe Grid-MakerBarcelona · 1815–1876
    5. 05Frederick Law OlmstedThe Park MakerNew York & Boston · 1822–1903
    6. 06Patrick GeddesThe SurveyorEdinburgh & Bombay · 1854–1932
    7. 07Georges-Eugène HaussmannThe PrefectParis · 1809–1891
    8. 08Daniel BurnhamThe PlannerChicago · 1846–1912
    9. 09William Barclay ParsonsChief EngineerNew York · 1859–1932
    10. 10Jane JacobsThe CriticNew York & Toronto · 1916–2006
    11. 11Shinji SogōFather of the ShinkansenJapan · 1884–1981
    12. 12Jaime LernerThe AcupuncturistCuritiba · 1937–2021
    KRoadmap

    What is done, what is being worked on, and what is not dated.

    Nothing below is a date dressed up as a commitment. Where a date is known it is stated; where it is not, the entry says so, because a roadmap that invents quarters is worse than one that admits it does not know.

    • Sep 2026Engine, four-step model and workerPure TypeScript, deterministic, no Math.random. Verified end to end against the Minneapolis pack.Completed
    • Sep 2026Model specification publishedCoefficients, utility functions, provenance, validation and seven named limitations, in docs/MODEL.md.Completed
    • Sep 202654 metro packs from federal open dataOne script, no API key. 127,792,392 residents across 31,521 census tracts, and 148 real transit routes with 3,143 real stations on the 15 metros whose agencies publish a rail feed.Completed
    • Sep 2026Eight decades, seven modes, 112 eventsPlus the operating budget, the labour model and the strike, the career ladder and six per-city victory conditions.Completed
    • Sep 2026Onboarding: six-step walkthrough and Field NotesThe single biggest cause of refunds in this genre, addressed first rather than last.Completed
    • NowStation upgrades and derived district identityFive upgrades that act through existing model channels, and seven characters read from live tract numbers every year: in the engine and affecting outcomes, not yet in the interface. The station panel and the district label on the map are what is left.In progress
    • NowA hosted browser build of the free editionMinneapolis–Saint Paul, 2025, complete. Until it is up, the source runs locally in three commands.In progress
    • NowPerformance on mid-range phonesThe simulation runs in a worker, but the hero and the map have only been measured on desktop. This is stated as unmeasured rather than claimed as fine.In progress
    • Not datedA Steam page, with wishlistsAnd an honest build-state label on it. Early Access means Early Access.Planned
    • Not datedMetros outside the United StatesThe pipeline is a script and a pack is a file, but every source it reads is a US federal dataset. Other countries mean other sources, and that is a real piece of work rather than a toggle.Planned
    • Not datedPack format documentation, so other people can build citiesThe format is already a plain JSON file with a source string in it. What is missing is the document.Planned
    • Not datedAn entertainment districtBlocked on evidence, not on effort: LODES cannot separate a theatre from an accountancy firm. If a dataset that can is found, this ships.Planned
    LQuestions

    Including the hostile ones.

    What does it cost?

    The free edition is free and is not time-limited: one complete metro (Minneapolis–Saint Paul) in one decade (2025), with the entire simulation in it — the full demand model, every mode, the operating budget, the events, the strike, the land use and the whole progression ladder.

    A price for the full edition has not been set, because the full edition has not shipped. When it is set it will be on this page. The source is MIT licensed and on disk either way.

    Why is the free version the deep one? Usually a demo is the shallow one.

    Because the model is the entire claim. A demo that cripples the simulation would be advertising something the buyer does not receive. A demo that hands over one complete city proves the claim and makes the case for the other fifty-three metros and the other seven decades — which is what the full edition actually is.

    Locked cities and decades are shown, named and labelled, never hidden. A paywall that pretends the content does not exist is both a worse experience and a worse pitch.

    Does it need to be online?

    No, and it never will. There is no account, no server and no telemetry. City packs are files committed to the repository; the engine runs in a worker in your browser; saves are yours. Load the page once and you can disconnect.

    Was this built with AI?

    Yes — with Claude, stated here and in the repository's README unprompted. The research behind this project found that concealing AI assistance, not using it, is what cost a comparable title its audience: undisclosed AI use appears in roughly 15% of that game's Steam reviews and in its second most-upvoted one.

    The mitigation is not a promise, it is the artefact. The engine is open source, the model is specified in full, every calibration constant carries a comment citing its source, and the whole thing is deterministic — so none of it has to be taken on trust.

    Why are all the cities in the United States?

    Because the data pipeline reads US federal datasets: Census PL94-171, ACS, LEHD LODES and FHWA HPMS. Those are what make the observed commute matrix possible, and the observed commute matrix is the difference between this and a distance-based gravity model.

    Other countries have their own equivalents and they are not interchangeable. Non-US metros are on the roadmap as a real piece of work, not as a setting.

    Is this a game or a planning tool?

    A game. It is a strategic-level model, not a piece of practice software: it will tell you correctly that a line relieves a corridor and it will not tell you what happens at an intersection. It does not simulate streets, it does not do signal timing, and it will not produce anything you should put in front of a board.

    What it will do is be wrong in the ways real models are wrong, and show you where.

    How hard is it to get into?

    The walkthrough is six steps and teaches five verbs: read, site, build, run, and let the clock go. After that, Field Notes is a pull surface you open when you want to get better, and every note in it carries the file and function in the engine that produces the behaviour.

    It is still a deep game. The claim is not that it is easy, it is that you will not have to open a forum in another tab to find out what a button does.

    How is this different from the other real-data transit games?

    Four things a person who owns them can check in about a minute. Interurban seeds work trips from observed LEHD LODES origin-destination pairs and predicts only the change the network causes, rather than synthesising the whole matrix from a distance-based gravity model. It runs eight decades, each moving nine independent levers, rather than one present day. It has seven modes including bus, BRT and ferry, rather than being subway-first. And every calibration constant sits next to a comment naming where it came from.

    “Real data” is not the differentiator. It is a floor, and several of these games clear it. What is on the page for checking is the method.

    Will my saves survive an update?

    That is the intention and it is one of the specific failures this project is designed around — “updates break existing saves” is one of the most-upvoted complaints in the competitive research. The save format is versioned. It has not yet been through a real migration in public, so this is a design commitment rather than a track record, and it is described that way on purpose.

    Can I see the model before I play?

    Yes. The model specification gives the four steps, the trip generation rates by purpose, the distribution form, the nested-logit coefficients, the assignment method, the operating-cost split and its labour content, the cost-overrun distribution, the fare elasticity and its provenance, the validation figures, and the seven things the model cannot do.

    It is written as documentation rather than as marketing, and it is the most useful page on this site.

    Fifteen thousand five hundred and eighty miles.

    That is how much interurban railway the United States had at its 1916 peak — briefly the largest electric railway system ever built, across forty states, the only serious competitor the steam railroads had before the car. It came out at about 650 miles a year through the 1930s. By 1943 there were 2,680 miles left. By 1950, 1,519.

    Every American metro in this game is shaped by a network somebody built and somebody else removed. You are the next person to try.

    Minneapolis–Saint Paul, 2025, complete. No download. No account. MIT licensed.