Interurban / Press
Press kit
Everything below is checkable. Where a figure is a count of something in the repository, the file it came from is named; where it is a published statistic, the dataset is named. If something here is wrong, it is a bug and we would like to know.
Description, three lengths
One line
Interurban is a transit planning simulation on 54 real US metros, built on federal open data and a four-step travel demand model that shows its work.
One paragraph
Interurban is a transit planning simulation in which you take office in one of 54 real US metropolitan areas, pick a decade between 1920 and 2040, and build a network. The city is not invented: every census tract carries its real 2020 population, its real jobs by workplace and its real median household income, and work trips are seeded from the observed LEHD LODES home-to-work commute matrix rather than synthesised from distance. Ridership is computed by a four-step travel demand model of the kind metropolitan planning organisations use — trip generation, pivot-point gravity distribution, nested-logit mode choice and frequency-based transit assignment, iterated to equilibrium. Cost overruns are drawn from the distribution Bent Flyvbjerg's work on large infrastructure describes. The model's coefficients, its sources and its seven named limitations are published in full.
Three paragraphs
Use the paragraph above, then:
An era in Interurban is not a vehicle catalogue. Each of the eight decades
moves nine independent levers: metro population, how centralised it is, cars
per household, real construction cost, land acquisition friction, the fare,
the share of operating cost somebody else pays, the federal capital match, and
what technology exists. In 1920 transit was a business expected to turn a
profit and there was no federal transit money at all; by 2025 roughly seven of
every ten operating dollars are somebody else's political decision. Playing
1920 and playing 2025 are not the same activity.
The name is the premise. The interurbans were America's first regional rail
network and briefly the largest electric railway system ever built —
15,580 miles across forty states at their 1916 peak, the only serious
competitor the steam railroads had before the car. They were pulled up almost
as fast as they went in, at roughly 650 miles a year through the 1930s, leaving
2,680 miles by 1943 and 1,519 by 1950. Modern light rail is their direct
descendant. Every American metro in this game is shaped by a network somebody
already built and somebody else removed, and the player is the next person to
try.
Fact sheet
| Item | Value | Where it comes from |
|---|---|---|
| Title | Interurban | Use the full string “Interurban — a transit planning simulation” on first mention; the bare word is a dictionary word. |
| Genre | Simulation / strategy / management | |
| Platform | Web browser | Runs offline once loaded; no account, no server, no telemetry. |
| Status | Not launched. No store page, no reviews, no players. | |
| Price | Free edition free; full edition price not yet set | src/engine/edition.ts |
| Licence | MIT | LICENSE |
| Metros | 54 | public/cities/index.json |
| Decades playable | 8 | 1920, 1950, 1960, 1975, 1992, 2010, 2025, 2040 — src/engine/eras.ts |
| Modes | 7 | Metro, commuter rail, light rail, streetcar, BRT, local bus, ferry — constants.ts |
| Events | 112 | 17 fiscal, 25 political, 19 operational, 9 social, 27 exogenous, 15 opportunity — events.ts |
| Time periods modelled | 6 | AM peak, midday, PM peak, evening, night, weekend — constants.ts |
| Progression ranks | 12 | Real planners, Harry Beck to Jaime Lerner — ranks.ts |
| Victory conditions | 6 | Computed per city from its own starting position — victory.ts |
| Free edition | Minneapolis–Saint Paul, 2025 | The complete simulation on one metro — edition.ts |
| AI disclosure | Built with AI assistance (Claude) | Stated in README.md unprompted |
The data
All free, permissive, no API key. Verified 28 September 2026.
- Census TIGERweb — tract boundaries, centroids, land area, hydrography, roads
- Census 2020 PL94-171 — population, population 18 and over, occupied households
- ACS 2018–2022 5-year, B19013 — median household income; suppressed tracts are recorded as unknown, never estimated
- LEHD LODES8 2022 — jobs by workplace and sector, workers by residence, and observed home-to-work commute flows
- FHWA HPMS 2020 — traffic counts and lane counts
- Agency GTFS feeds — real transit lines, stations and official line colours, with real opening years
15 of the 54 metros start with real rail already on the map, carrying 148 real transit routes and 3,143 real stations between them, in each agency's own published line colours. The other 39 start with nothing, which is also true of them. Where an opening year is not documented, the line is absent from earlier eras rather than given a guessed date.
Counted from public/cities/index.json on 29 September 2026. The
repository README still quotes 42 routes and 713 stations across six metros,
which was accurate when the game had six cities; it is stale and this is the
current figure.
The validation, if you want a number to quote
| Network built | Modelled weekday journeys | Real system |
|---|---|---|
| One metro line, 16 stations | 27,500 | METRO Blue Line, ~25–30,000 |
| Three rail lines, 50 stations | 64,600 | Metro Transit rail, ~60–70,000 |
| Trip generation | 3.94 / person / day | US household travel surveys, 3.5–4.5 |
If you quote those, the two caveats in the model page belong with them: station spacing changes the answer by an order of magnitude, and regional mode share comes out below the real system's because a test network is sparser than an agency running a hundred bus routes.
Assets
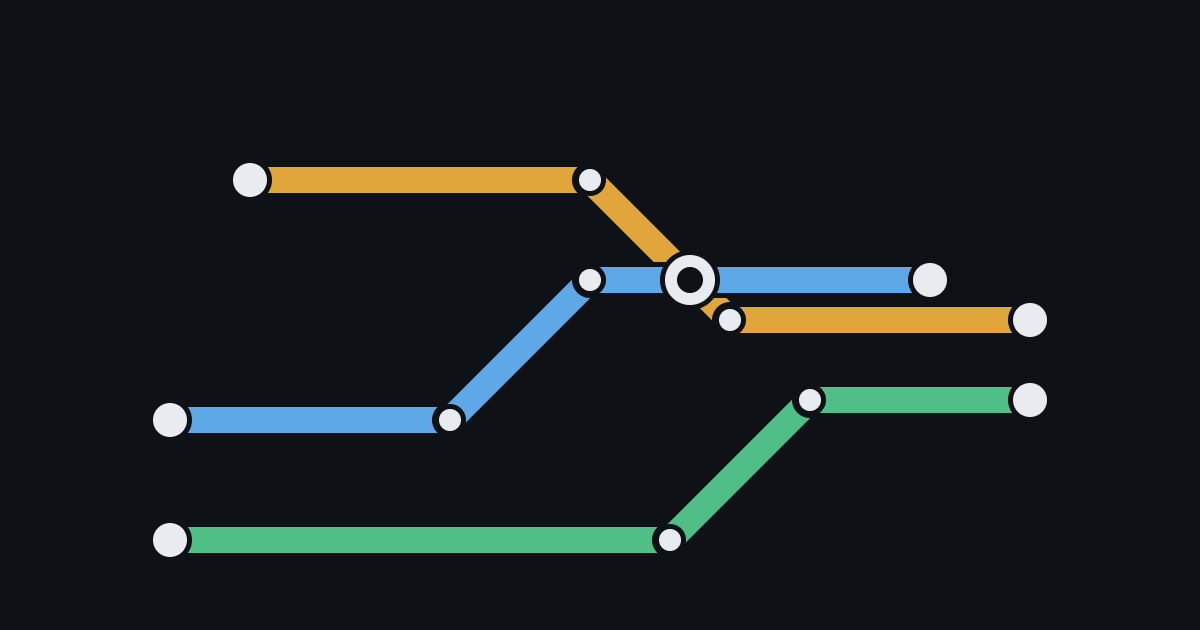
- The mark (SVG, no background tile) — two termini and the 45-degree turn between them. Beck's move, and literally what an interurban is: the line between two places.
- The small cut (SVG, on a tile) — for sizes below 32 px, with the midpoint tick dropped.
- Social card (PNG, 1200×630)
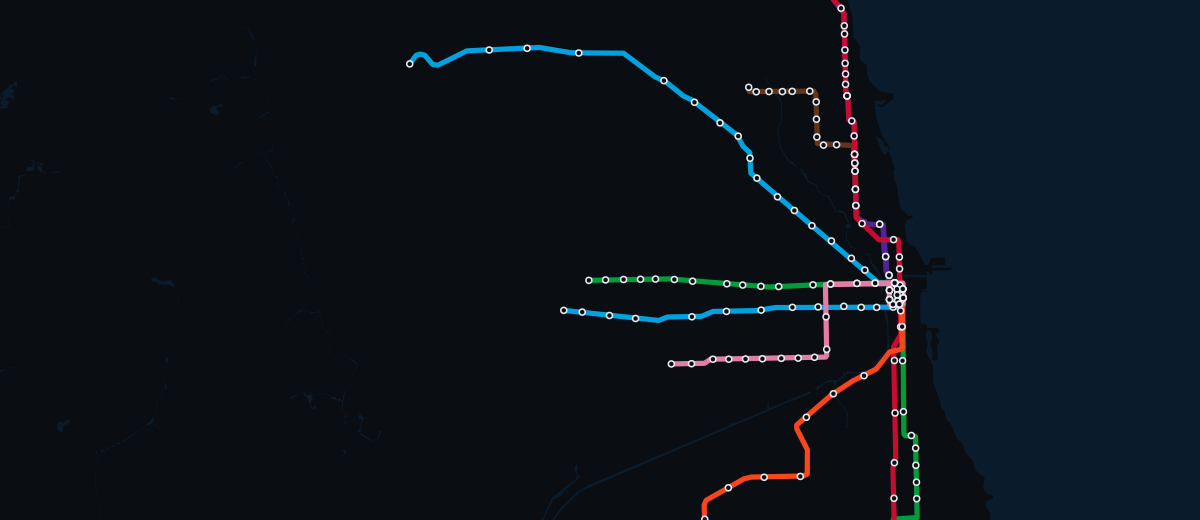
- The Chicago ‘L’ as the game draws it (SVG, 1200×520) — eight lines in the CTA's own published colours, 185 stations, over Lake Michigan.


Typefaces: Barlow Condensed (display and signage), Inter (interface), IBM Plex Mono (every figure, always tabular). Palette: ground #0E1116, panel #12171F, rule #242C38, ink #E8ECF1, accent #5FA8E8, good #4FBF87, warn #E0A63C, critical #E2685E.
Things this page will not claim
Because they are not true, and a press kit that inflates them makes every other number on it worthless:
- There are no review scores. The game has not launched.
- There are no player numbers, wishlists or downloads.
- There are no press quotes, and the slot for them on this site is deliberately empty rather than filled with something borrowed.
- There is no release date. The roadmap dates what is known and says “not dated” where it is not.
- The station-upgrade and district-identity systems are in the engine but not yet in the interface. If you write about them, that is the accurate framing.
The one quote on this site, and where it is from
Section 06 of the home page carries six quotations. Every one is a Steam
review of a different, existing game in this genre, pulled from the
1,375 reviews collected in research/data/ in the repository, and
each is labelled as such. None of them is about Interurban. They are there
because they are the design brief, not because they are praise.